 ar
ar bg
bg hr
hr cs
cs da
da nl
nl fi
fi fr
fr de
de el
el hi
hi it
it ko
ko no
no pl
pl pt
pt ro
ro ru
ru es
es sv
sv tl
tl iw
iw id
id lv
lv lt
lt sr
sr sk
sk sl
sl uk
uk vi
vi et
et hu
hu th
th tr
tr fa
fa ms
ms hy
hy ka
ka ur
ur bn
bn mn
mn ta
ta kk
kk uz
uz ku
ku
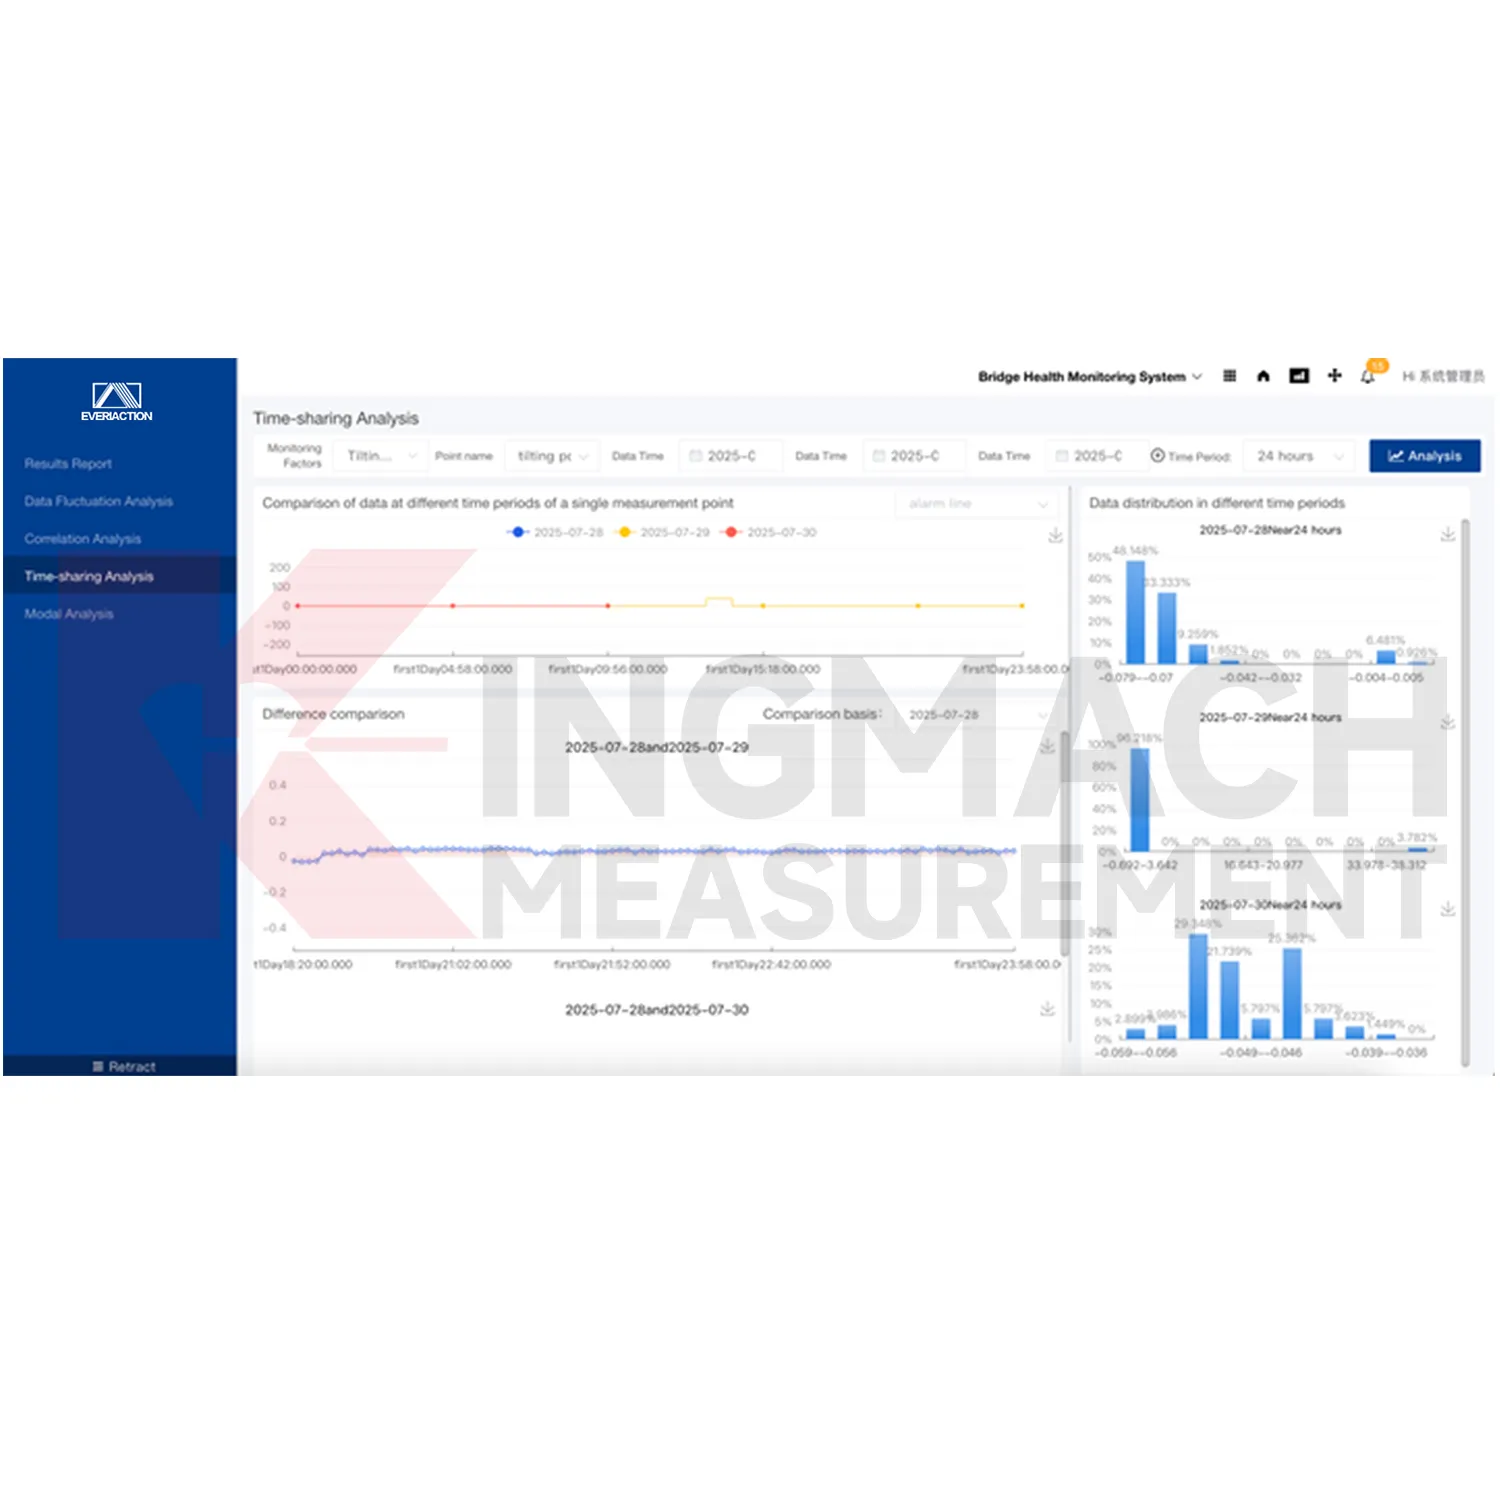
Visualization Software
Kingmach Visualization Software can work with different sensor categories across the Kingmach product ecosystem. It may receive data from strain gauges, load cells, displacement transducers, settlement sensors, tiltmeters, environmental monitoring devices, accelerometers, weir flow meters, readouts, data loggers, and related acquisition hardware. The benefit is not only that the data appears on one screen. The benefit is that related structural behavior can be compared across channels, making it easier to understand whether a change is local, environmental, construction-related, or part of a wider asset response.
Application of Visualization Software
Building monitoring uses Kingmach Visualization Software when settlement, tilt, crack displacement, vibration, temperature, or foundation pit influence must be reviewed over time. Urban projects often involve nearby construction, traffic, equipment vibration, and changing occupancy conditions. The platform helps organize sensor readings and alarms by project, making it easier to compare today's behavior with baseline records. Graphical display is useful for owners and engineers who need to understand whether movement is stable, event-related, or growing.
The future of Visualization Software
IoT development will make Kingmach Visualization Software more important because field devices will keep expanding in number and variety. A bridge, tunnel, dam, or slope may use wired channels, wireless nodes, edge loggers, weather stations, and third-party devices at the same time. The platform's compatibility with different manufacturers, types, and models supports this mixed-device future. As monitoring networks grow denser, device access, channel naming, alarm rules, and project organization will matter as much as the individual sensor.
Care & Maintenance of Visualization Software
User roles and access control are part of maintaining Kingmach Visualization Software. Owners, engineers, inspectors, operators, and report reviewers may need different permissions. Limit configuration changes to trained users and keep a record of edits to alarm rules, project information, device settings, and report layouts. This protects data integrity and makes it easier to explain later why a trend, alarm, or report changed. Good access discipline is especially important for cloud-based monitoring records.
Kingmach Visualization Software
Kingmach Visualization Software turns scattered field readings into a project view that engineers, owners, and maintenance teams can actually use. A monitoring site may include strain gauges, load cells, displacement meters, settlement sensors, tiltmeters, water-level instruments, environmental sensors, accelerometers, acquisition modules, and data loggers. Without a central platform, each channel can become a separate file or screen. The Monitoring system software platform receives and stores multi-dimensional monitoring data in real time, then presents trends, alarms, reports, and project records in a clearer form. This helps users understand the status of bridges, tunnels, slopes, buildings, dams, subgrades, and foundation pits before small changes become difficult to trace.
FAQ
Q: How are trend curves used?
A: They help compare current readings with earlier behavior so gradual movement, sudden jumps, or event response can be reviewed.
Q: What does real-time filtering help with?
A: It reduces noisy or distracting records before users study the channel history.
Q: How do alarms guide action?
A: Configured rules point users toward the affected point, severity level, time, and related follow-up record.
Q: What makes reports easier?
A: Stored trends, alarms, project files, and expert review notes can be gathered without rebuilding the evidence manually.
Q: Why is graphical display useful?
A: Graphs help users see movement direction, timing, and abnormal patterns faster than raw tables alone.
Reviews
Michael Anderson
The strain gauges and load cells are extremely accurate and stable. They performed very well in our bridge monitoring project. Highly recommended!
Christopher Martinez
Very satisfied with the readouts & data loggers. User-friendly interface and supports multiple sensor inputs.
Latest Inquiries
To protect the privacy of our buyers, only public service email domains like Gmail, Yahoo, and MSN will be displayed. Additionally, only a limited portion of the inquiry content will be shown.
Ava***@gmail.comAustralia
Hi, I am looking for reliable tiltmeters and accelerometers for structural health monitoring. Please...
Isabella***@gmail.comGermany
Hello, we are evaluating weir flow meters for a water management project. Please share accuracy deta...
Related product categories
- Monitoring Software Suite
- Monitoring system software platform
- Environmental Monitoring
- Visualization Software
- GPS Displacement Monitoring System
- Integrated Monitoring Station
- Settlement Monitoring Rod
- Structural Health Monitoring (SHM) System
- Structural Monitoring Cloud Platform
- IoT Online Monitoring System
- Monitoring System Platform & Services
- Engineering Pulse Intelligent Monitoring Cloud Platform